The opportunities are endless for hosts who wish to generate extra income through the Airbnb platform. Whether you have an entire property available, or just wish to rent out some private or shared rooms, then you can tap into the huge Airbnb market.
- 13 574 – listings in total
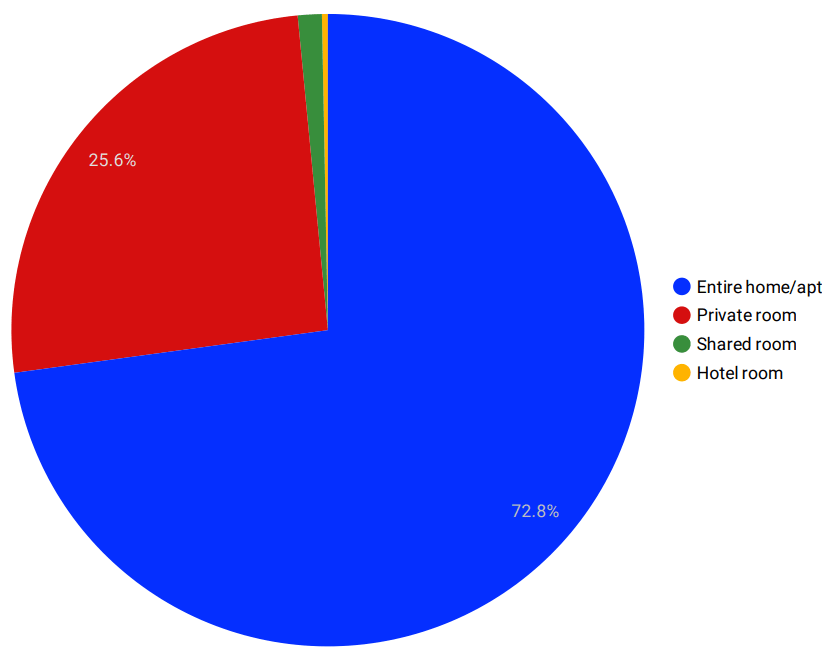
- 9 888 (72.8%) – percentage of the total which are entire properties
- $213 – average price per night
- 3 479 (25.6%) – private rooms
- 166 (1.2%) – shared rooms
- 41 (0.3%) – hotel rooms

9 888 (72.8%) – entire properties
3 479 (25.6%) – private rooms
166 (1.2%) – shared rooms
41 (0.3%) – hotel rooms

In order for the guest activity to be recorded and monitored, a review must be submitted to a host’s property or room after the stay has been completed. In terms of the statistics that have been produced – they have been calculated by using the minimum stay, the average price per night and the total number of reviews.
- 101 – estimated nights per year
- 1.6 – average reviews of listings per month
- 344 551 – reviews in total
- $213 – average price per night
- 27.8% – estimated occupancy
- $1 273 – estimated average income generated per month
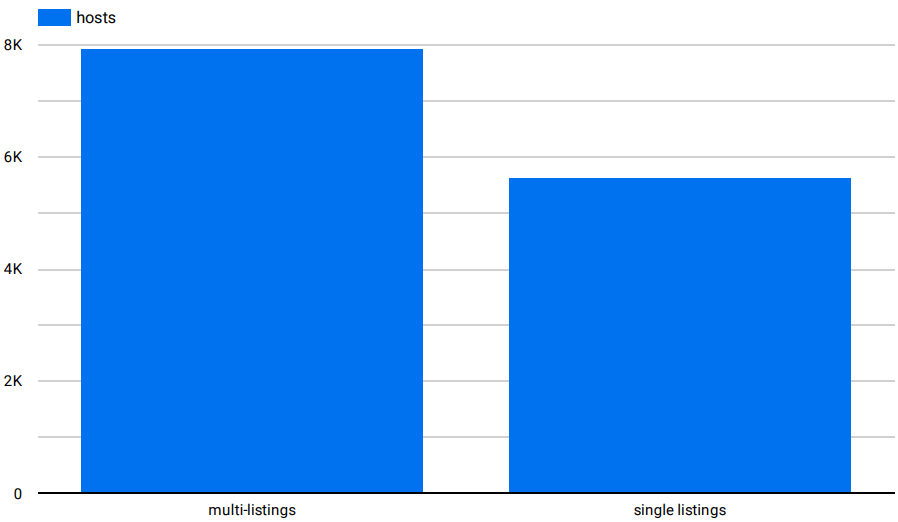
When you assess the Airbnb market in San Diego, you’ll notice that there are some hosts who have multiple listings and some that have single listings, just like everywhere else in the world. It is possible for a host to list multiple properties that they have available or different rooms which are available on the same property.
- 7 935 (58.5%) – number of multi-listings
- 5 639 (41.5%) – number of single listings

Listings belonging to the one host
Airbnb listings where host has more than one listing

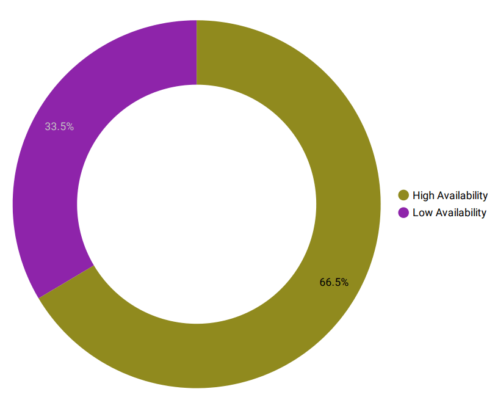
9 020 (66.5%) – high availability
4 554 (33.5%) – low availability
Airbnb hosts have full freedom when it comes to selecting how available their property or rooms are. For instance, by utilizing the calendar tool, a host can set their property to be available for just one week in a year. Alternatively, another example is a host setting their rooms to be available for 11-months out of the 12.
- 9 020 (66.5%) – high availability
- 4 554 (33.5%) – low availability
- 152.5 (41.8%) – average days per year
Sources


